swipe · 10 metrics
Ten operating metrics that help you decide.
Most dashboards track what is easy to measure. This guide pairs ten operating metrics with the decision each can inform, so you can choose the ones that fit your business model.
A look inside
See what you’re getting.
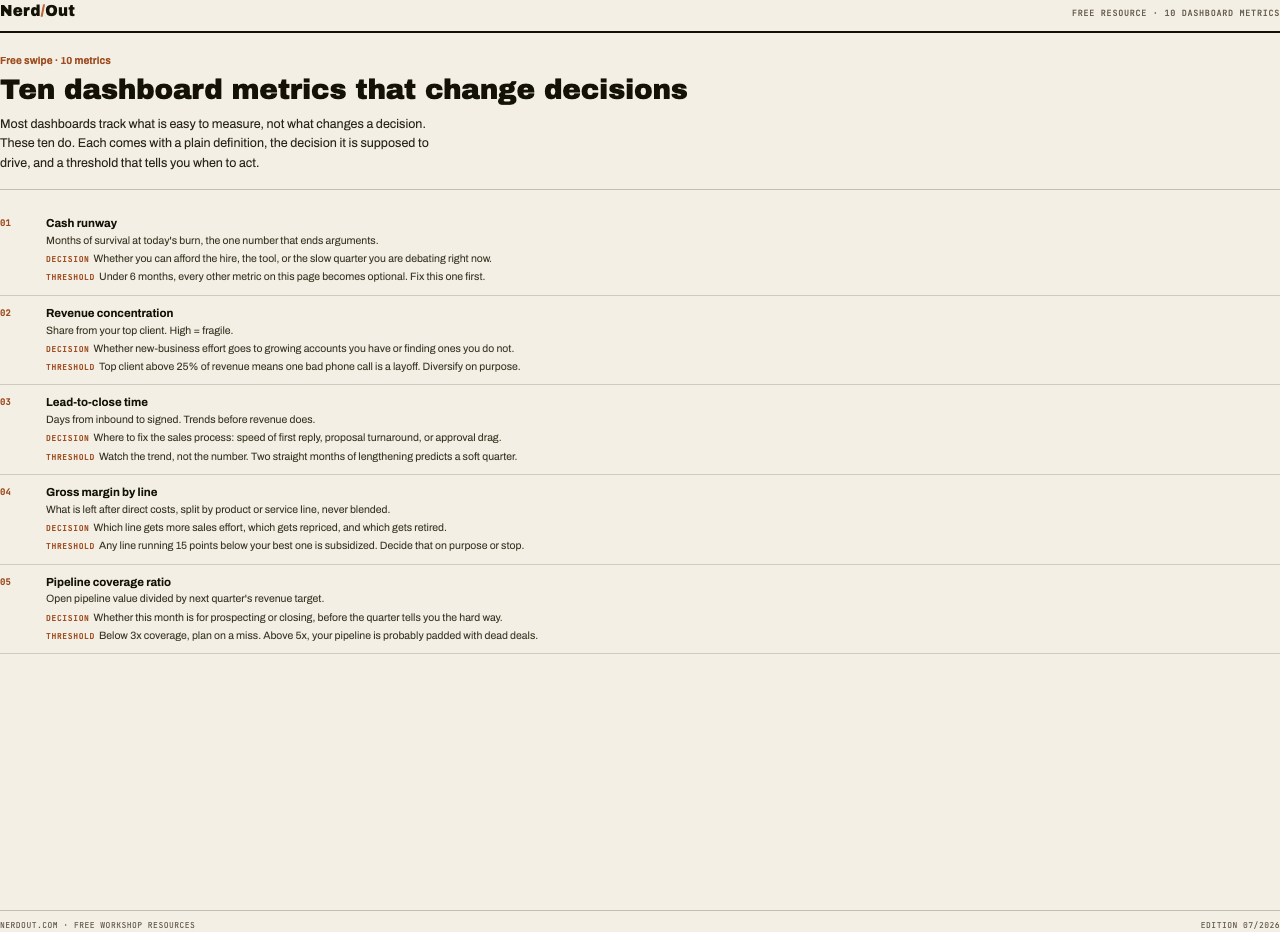
A real first-page preview of 10 Dashboard Metrics (PDF).
Want the complete resource? Get all 10 metrics.
Why trust the work
Built from operator experience.
Nick Horob helped build Harvest Profit with a six-person team before John Deere acquired the company in 2020. Nerd Out turns that operator experience into focused tools you can inspect before sharing your email.
Open metrics
Preview three metrics and open one complete decision-and-threshold example before you download the guide.
- 01Cash runway
Months of survival at today's burn, the one number that ends arguments.
- 02Revenue concentration
Share from your top client. High = fragile.
- 03Lead-to-close time
Days from inbound to signed. Trends before revenue does.
Ready to put it to work?
Get immediate access now and an email backup you can come back to.
Get all 10 metricsOne email with the download link. Unsubscribe anytime.